
IBIS. Your ERPNext data, turned into answers.
Connect your ERPNext site with an API key, sync the doctypes you care about, and build live charts, dashboards and forecasts in minutes — with AI that explains what the numbers mean.
Everything between raw doctypes and confident decisions.
IBIS syncs ERPNext doctypes into a per-tenant analytics store and gives your whole team a fast, visual way to explore them.
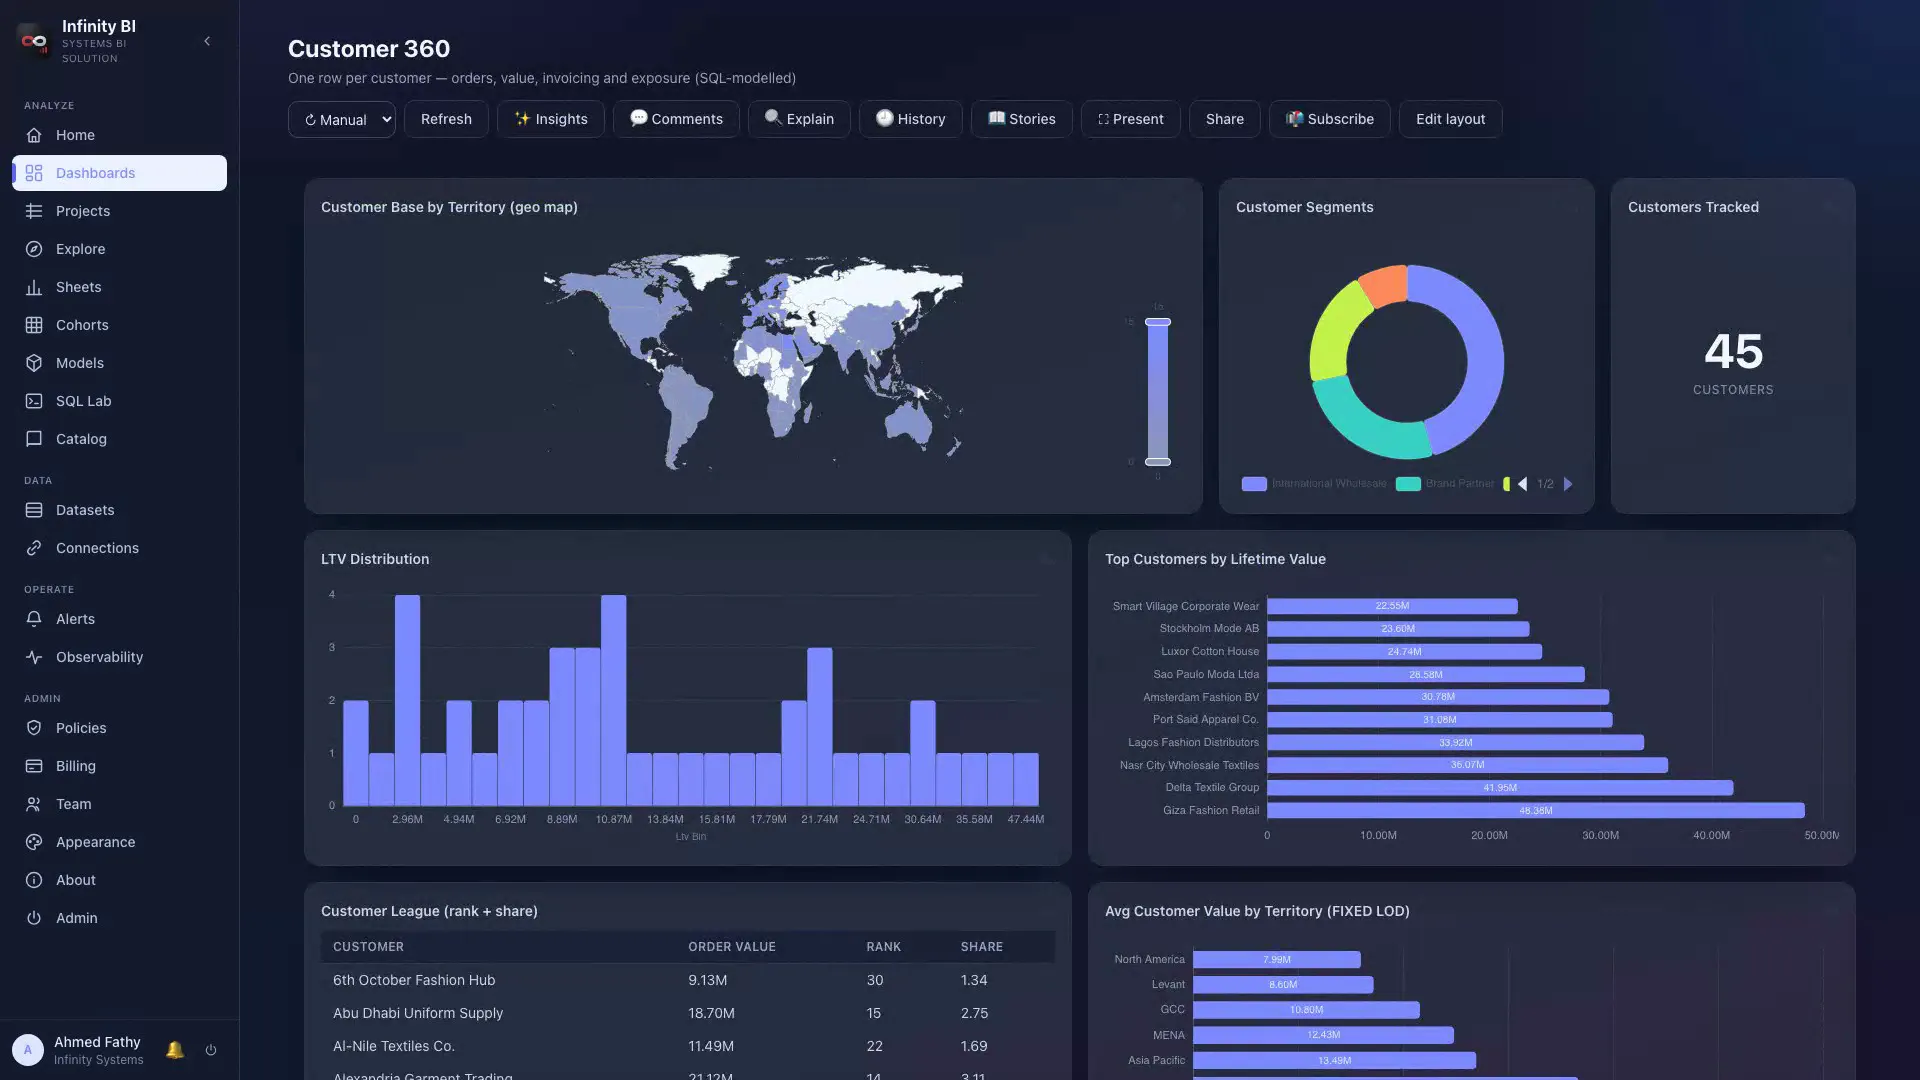
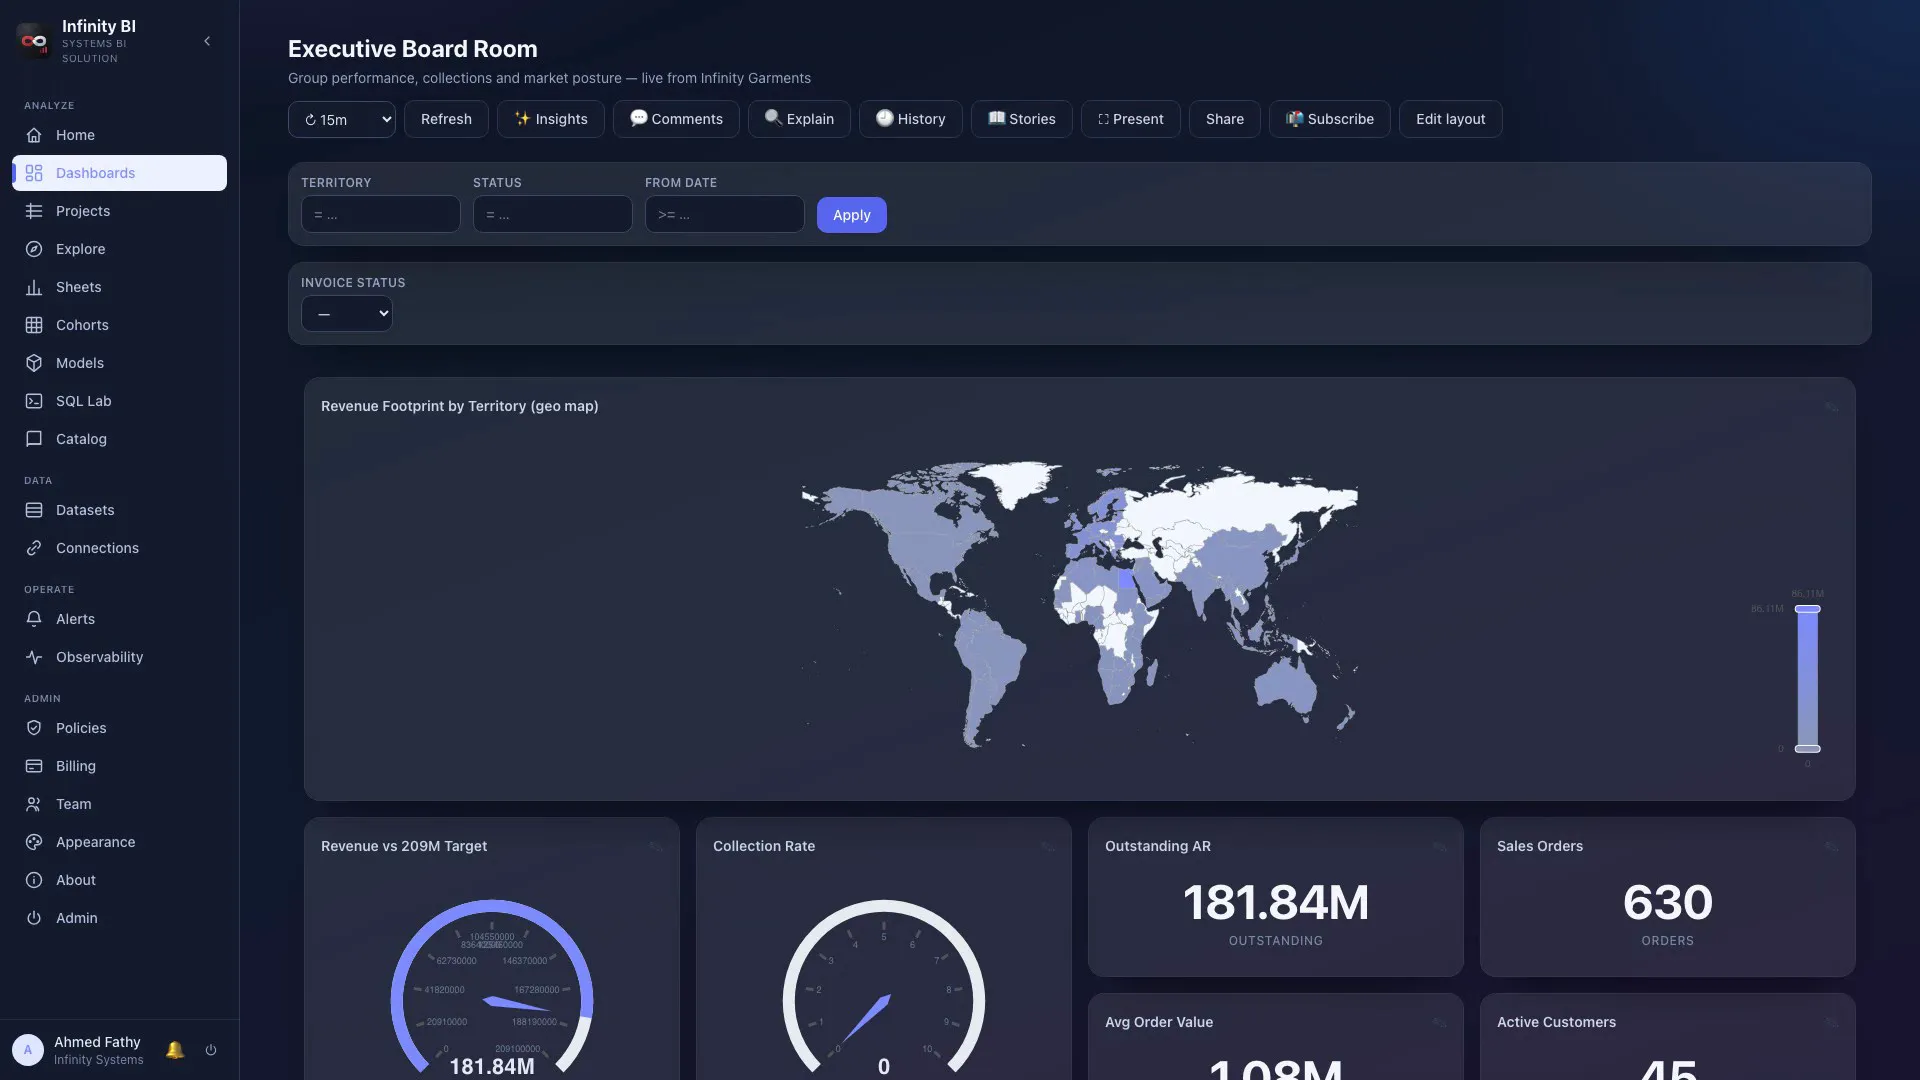
Command centers, not static reports
Assemble KPI tiles, trends, gauges and geo maps on a drag-and-drop grid. Dashboard-level filters and cross-filtering let you click any bar and watch every widget re-query live.
- Drag, resize and arrange widgets on a 12-column grid
- Dashboard filters, parameters and click-to-cross-filter
- Auto-refresh, sharing, subscriptions and version history
From question to chart in seconds
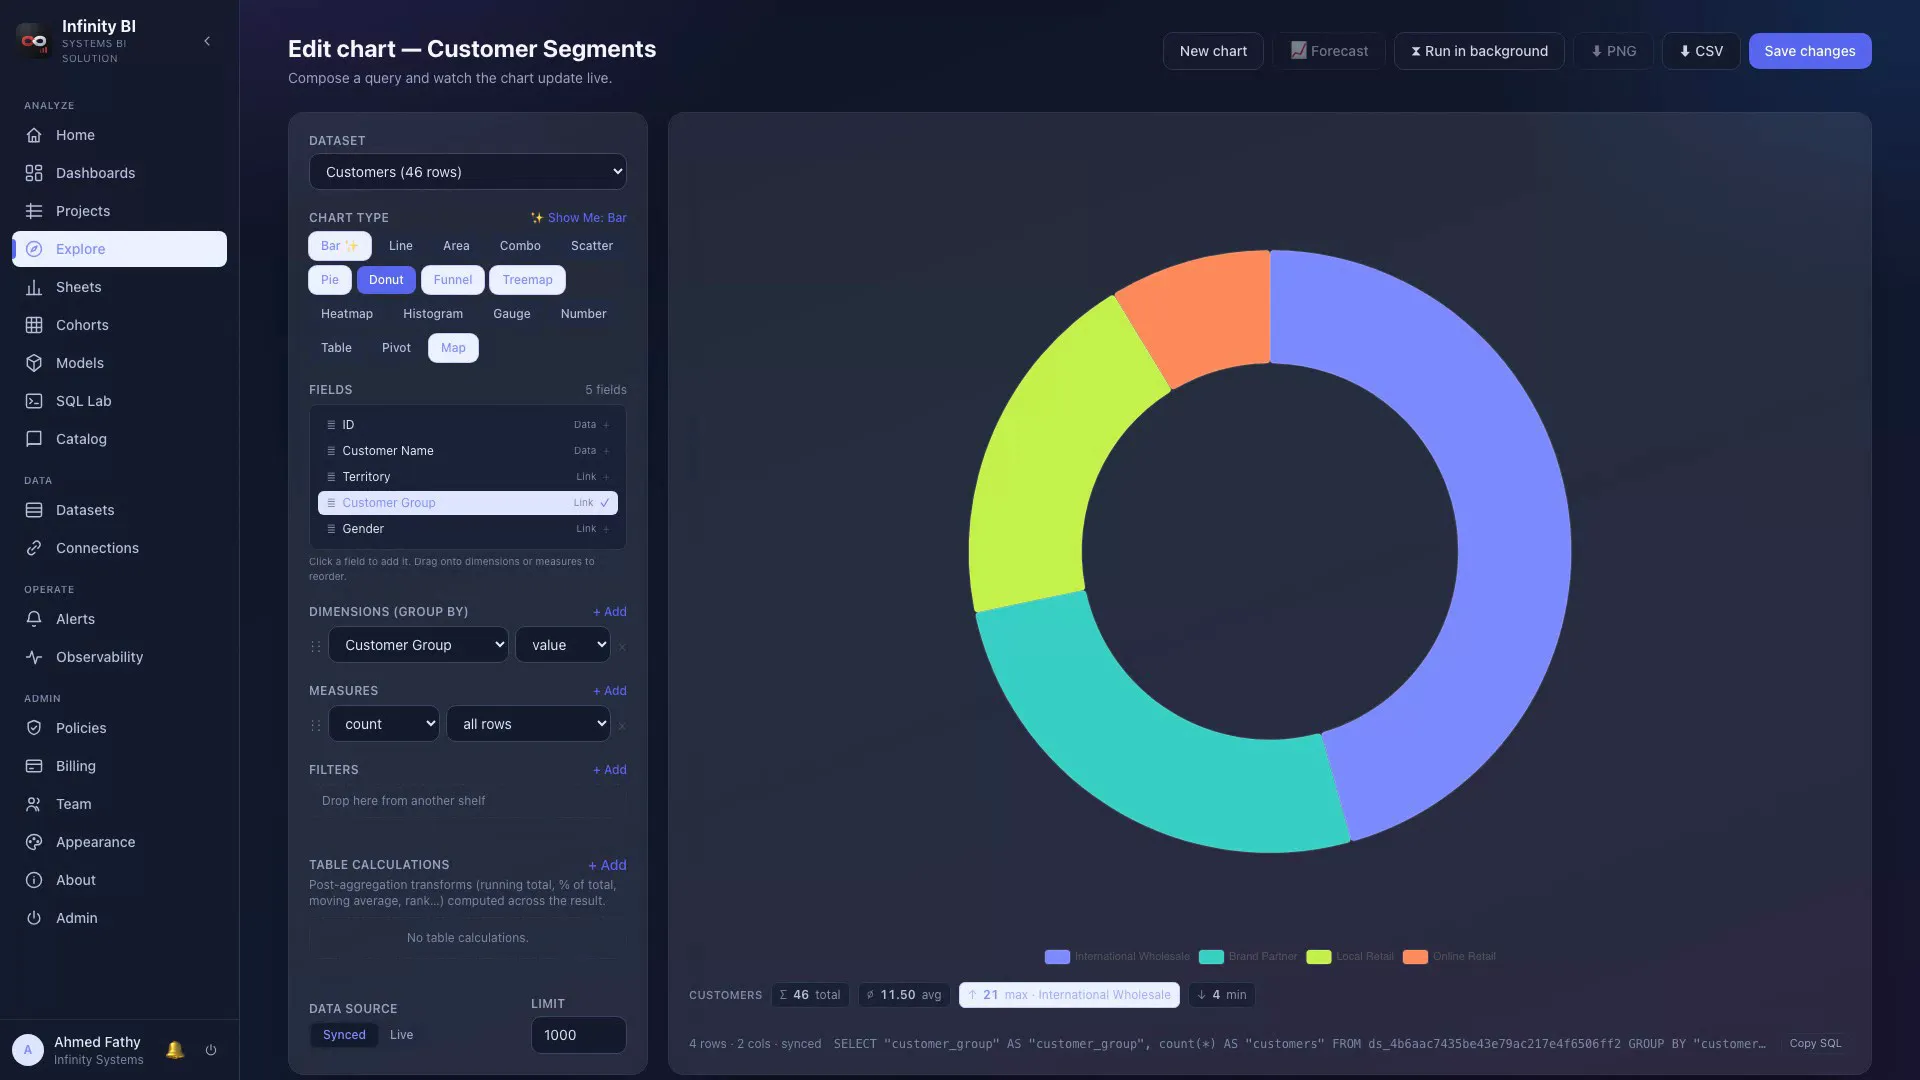
Pick a dataset, drag fields into dimensions and measures, and watch the chart update live. Sixteen chart types — from bars and lines to treemaps, funnels, heatmaps, gauges and world maps — plus a pivot table when you need the numbers.
- 16 chart types with one-click switching
- Filters, table calculations and forecasting built in
- Ask AI: describe the chart you want in plain English
Your dashboards, narrated by AI
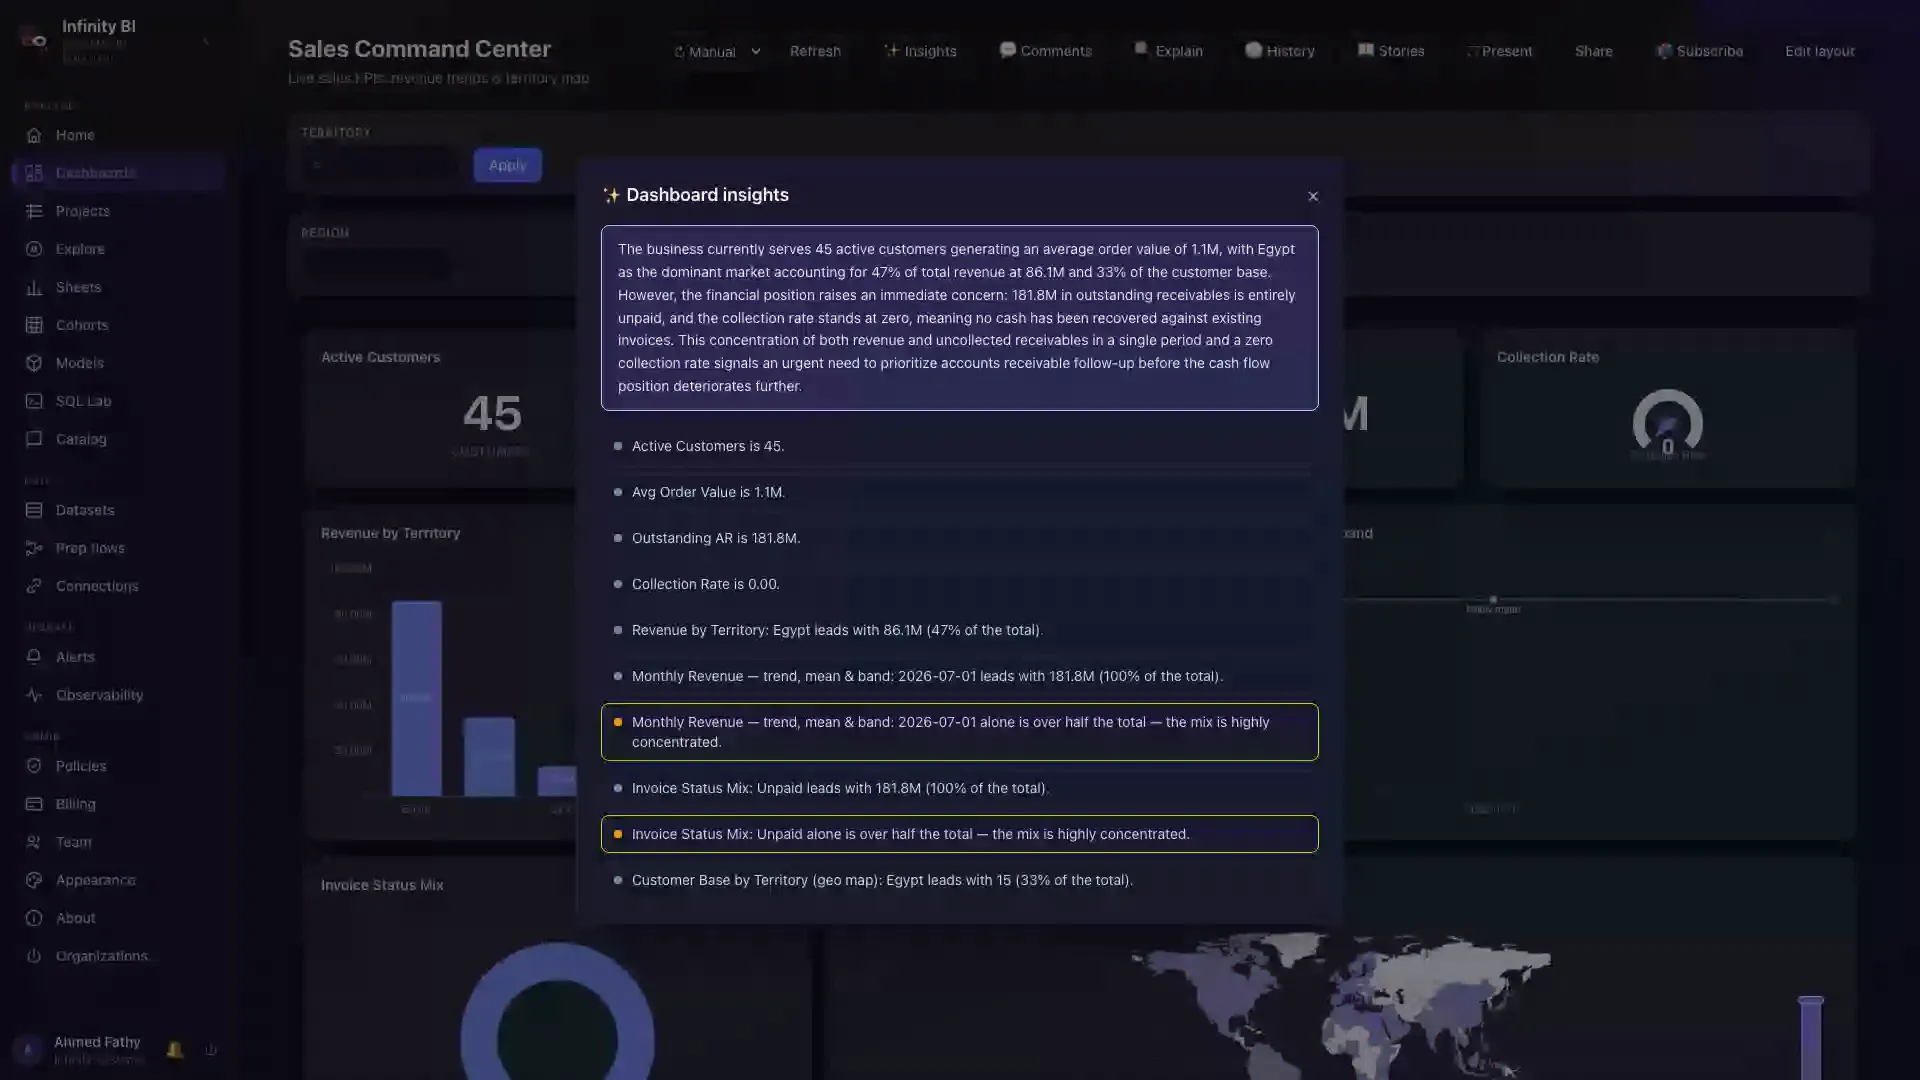
IBIS reads the numbers for you: one click generates a plain-language brief of what is driving revenue, what looks risky and what deserves follow-up — grounded in the exact widgets on the board.
- Dashboard-level AI briefs with highlighted anomalies
- Natural-language questions answered with charts
- English-to-SQL in the SQL Lab
A semantic layer your team can trust
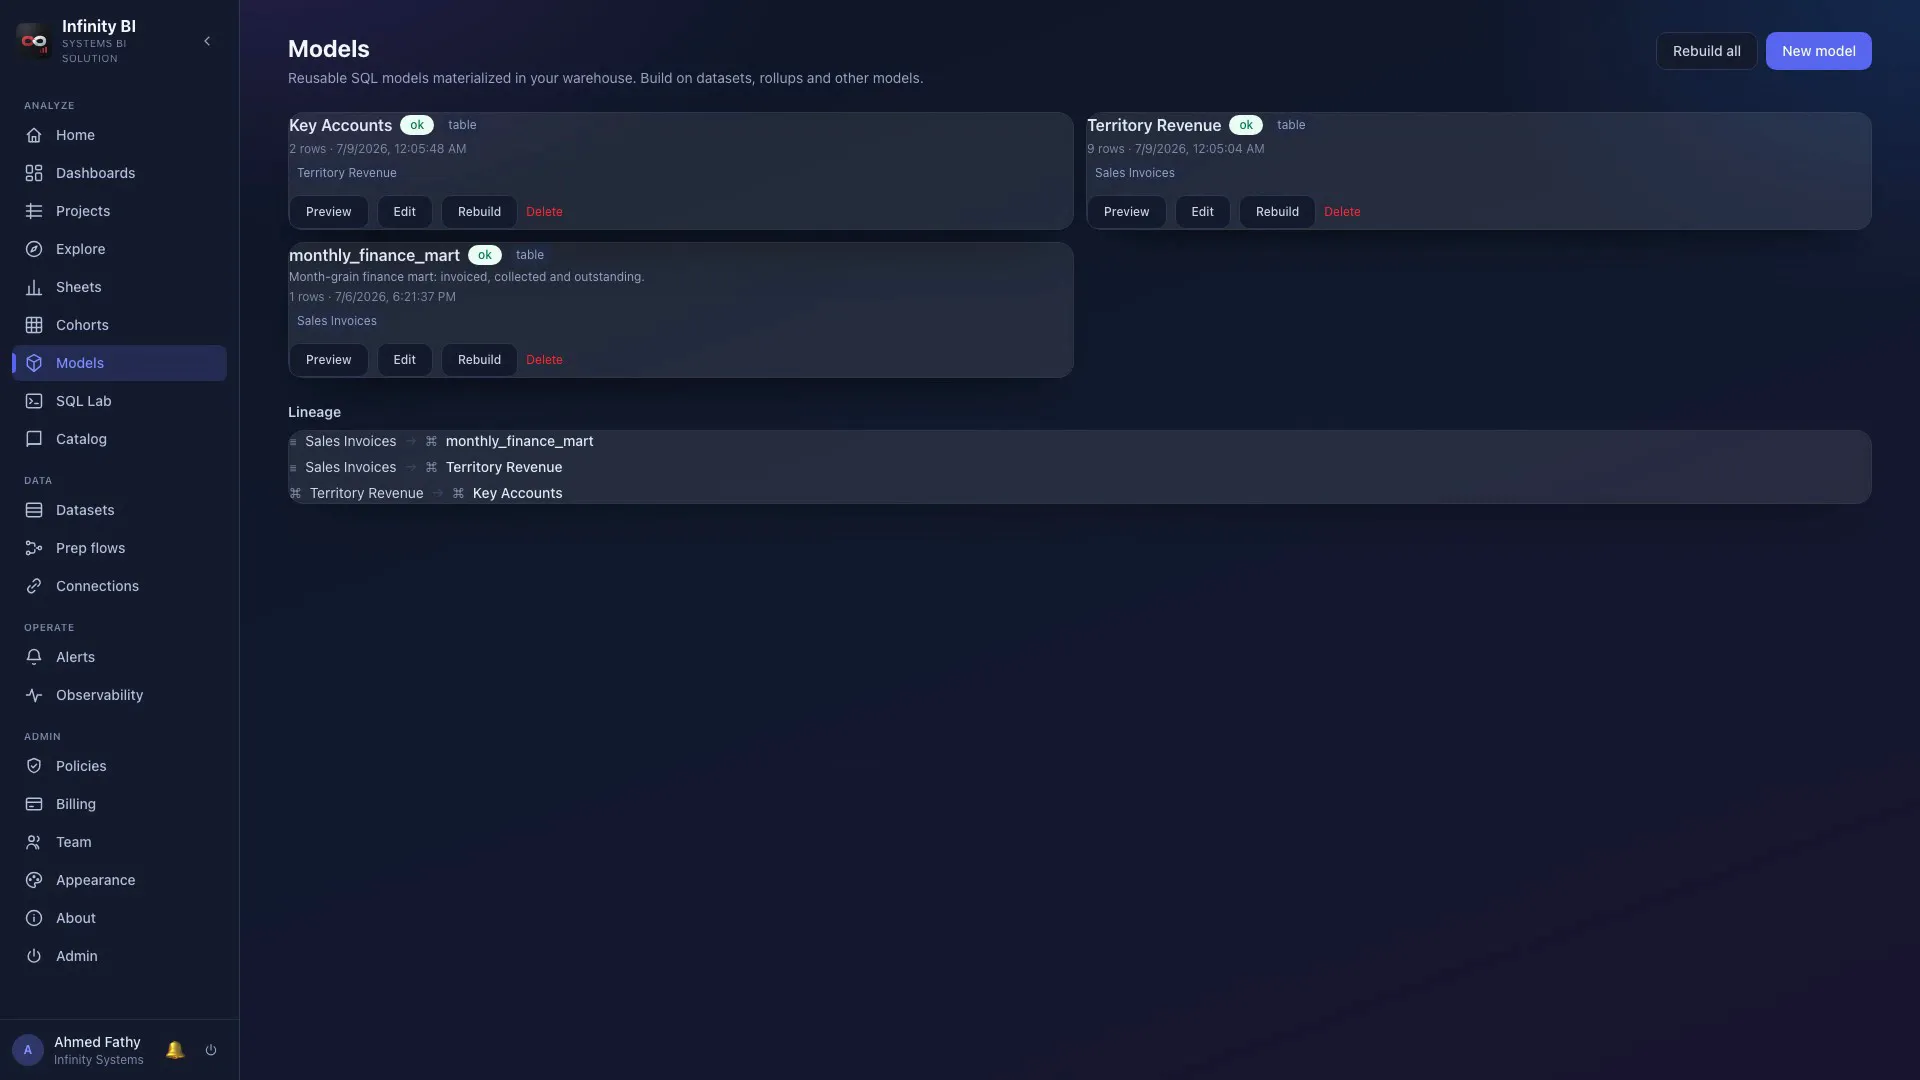
Materialize reusable SQL models, chain models on top of models, and read the lineage graph so everyone knows where every number comes from. Rebuild everything with one click when sources change.
- Materialized models with model-on-model chaining
- Visual lineage from raw doctypes to final metrics
- Data catalog with every asset searchable and tagged
Cohorts, scenarios and forecasts
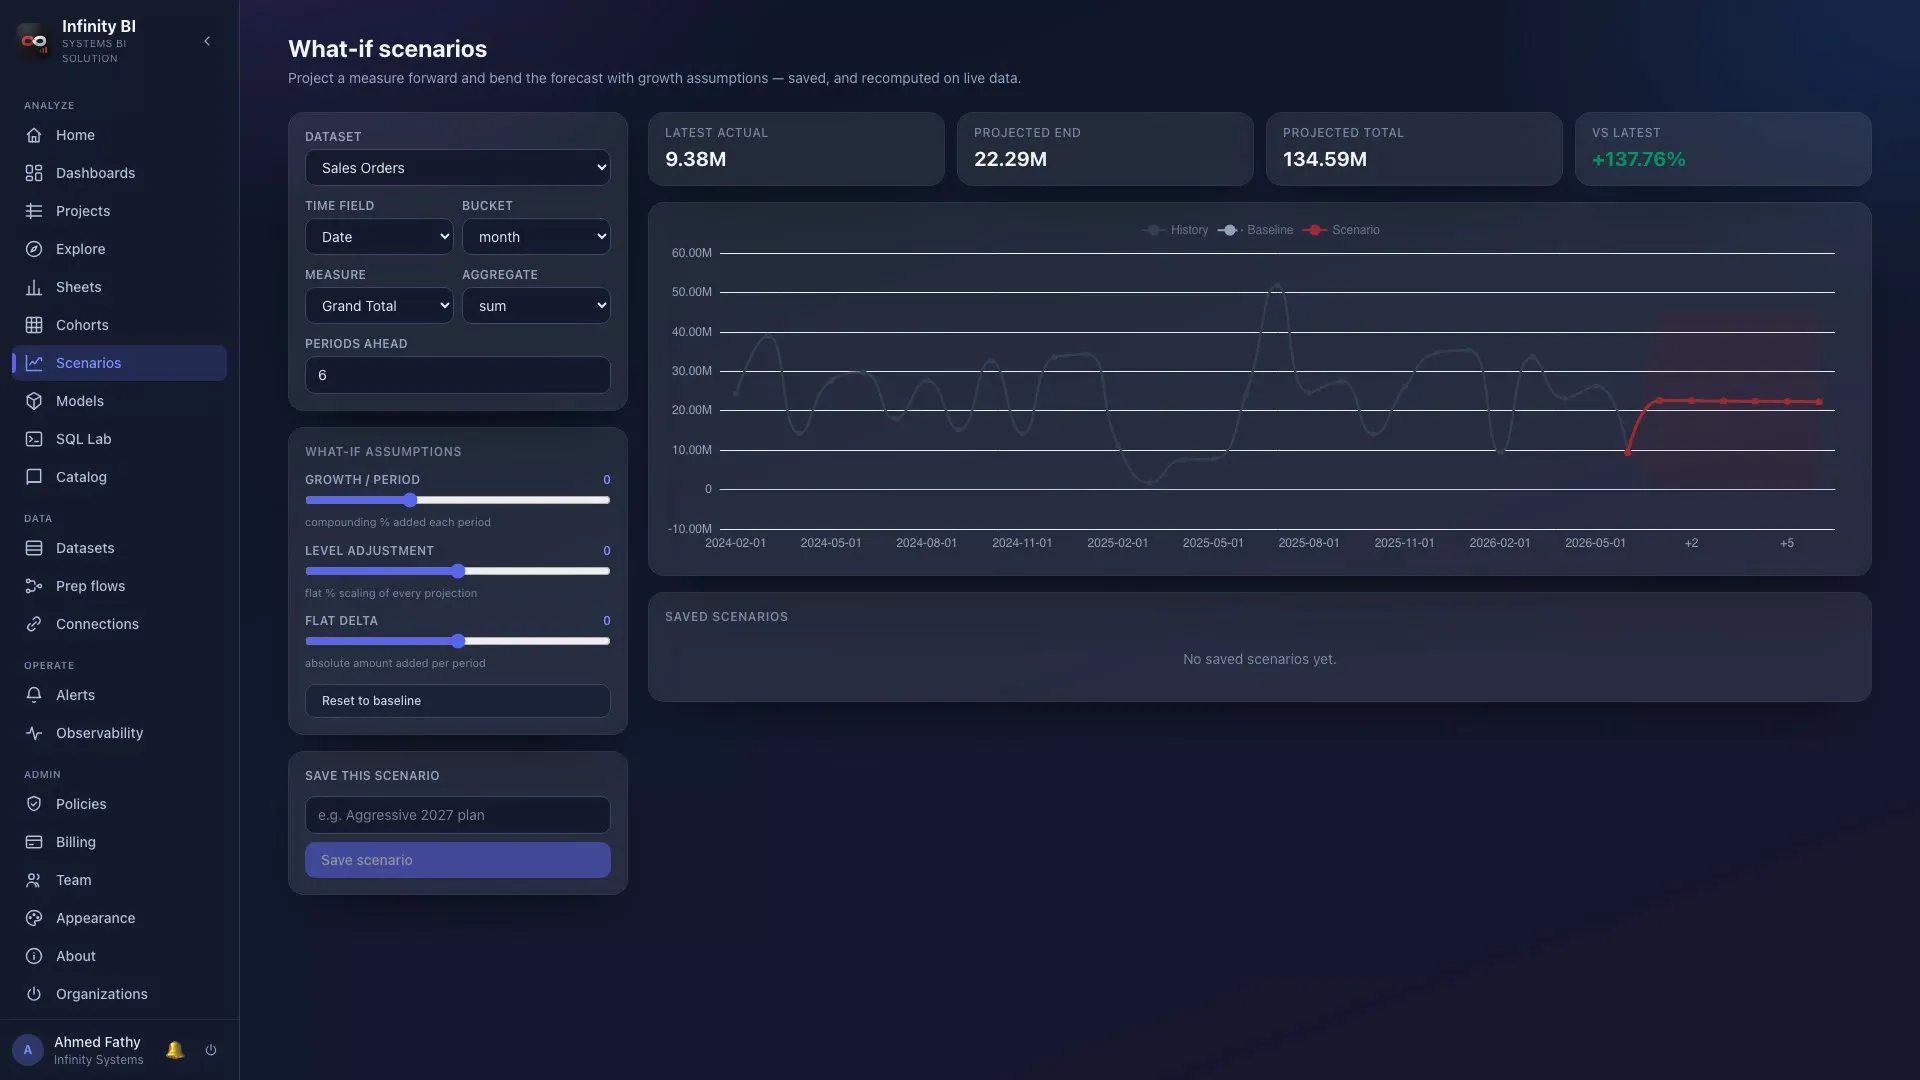
Go past descriptive reporting: build customer retention matrices, play what-if scenarios on growth assumptions, and project forward with forecast bands — all on your live ERP data.
- Cohort retention triangles by month or quarter
- What-if scenario planning with adjustable assumptions
- Trend forecasting on any time series
Enterprise plumbing under a friendly surface.
- Strict multi-tenant isolation — each organization gets its own analytics store
- Connection secrets encrypted at rest; API-key access only, no database credentials
- Synced and live query modes return identical results — pick per chart
- Row-level security policies and per-member permissions
- SQL Lab with schema browser, query history and save-as-dataset
- Self-hosted or cloud — your data never leaves your control
Simple plans that scale with your team.
All prices in USD, billed monthly. Upgrade, downgrade or cancel at any time.
- 2 team members
- 2 ERPNext connections
- 10 datasets · 30 charts · 5 dashboards
- 5,000 queries / month
- Full platform & API access
- Scheduled email reports
- White-label & custom branding
- AI insights & narratives
- 5 team members
- 6 ERPNext connections
- 30 datasets · 90 charts · 15 dashboards
- 15,000 queries / month
- Full platform & API access
- Scheduled email reports
- White-label & custom branding
- AI insights & narratives
- Unlimited members & connections
- Unlimited datasets, charts & dashboards
- Unlimited queries
- AI insights & narratives
- Auto-refreshing dashboards
- SSO & SCIM directory sync
- Priority support